
ESSAY ON PAPER
Reconstruction of ancestral metabolic enzymes reveals molecular mechanisms underlying evolutionary innovation through gene duplication.Dec 14, 2012 PLoS biology
2
Show me the data - but in a clear and understandable way
Jul 30, 2013
1672 views
Two years and three months. That is how long it took to go from the first version of this paper to getting it published; I just double-checked. Before I go into more details about the science behind all this: I will be using ‘we’ throughout this entire piece, and for a very good reason. This paper truly is a great showcase of teamwork. Even while we were still performing experiments and gathering data, we realized that we would need analyses none of us in the lab were really familiar with. Our PI was the one bringing the people involved in this paper together, and who also kept pushing us to get the most out of the story (even at times where we all just wanted to bury this paper under a rock and never look at it again – writing a 37 page rebuttal, anyone?). In the end, the countless skype calls, discussions and (almost) never-ending email conversations with everybody involved really helped to improve the paper and add the finishing touch to it- including how to visualize all our data in a somewhat comprehensible way.
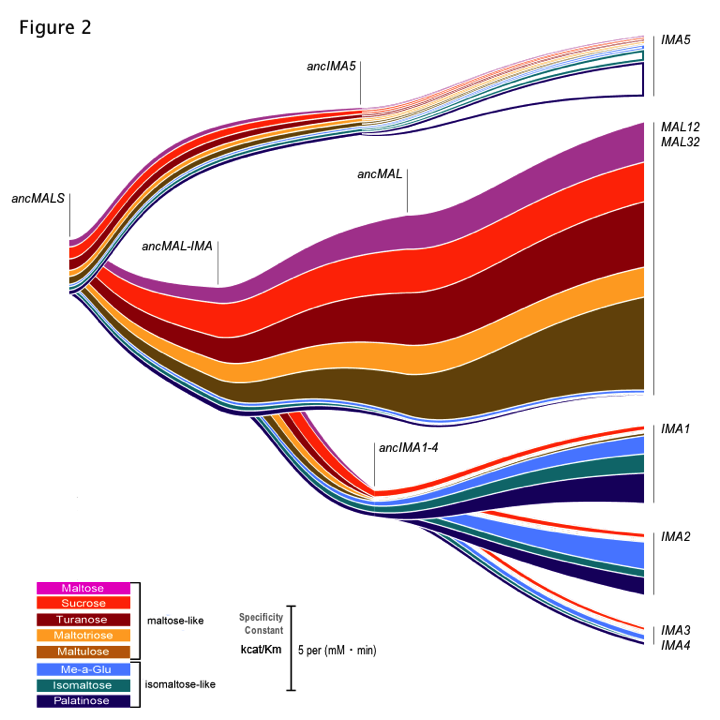
OK, back to the two years and three months. The idea for the paper actually dates back even further: Chris, an insanely smart and talented grad student in the lab, had just published a paper on subtelomeric gene families in yeast. He found that subtelomeric genes are frequently duplicated. The MAL gene family caught our attention: MAL genes are responsible for the uptake and hydrolysis of maltose, a very important sugar in beer brewing. Because of all these duplications, yeast contains an awful lot of these MAL genes, encoding transporters, activators and enzymes. Present-day yeast cells have seven copies of the maltose-hydrolyzing enzyme, which seems like a bit of overkill if they would all carry out exactly the same job. Growth assays indicated that they did not: it looked as if these different copies had different substrate preferences, and they did not all only hydrolyze maltose. We also knew these different present-day alleles originated from a single copy through repeated duplications. But what was the activity of this ‘ancestral’ allele? How could we determine activity of this (no longer existing) prehistorical enzyme?
This is where Chris used his computer magic (no worries, we gave a more scientific explanation in the paper) to predict the sequence of this ancestral enzyme, as well as the intermediate duplicates leading to the present-day copies, and we had these sequences synthesized. ‘And we had these sequences synthesized’: this sentence really does not reflect our excitement when this ‘reconstructed’ DNA arrived in the lab and we could start our experiments - imagine a 6 –year-old with a sugar high on its birthday, and you come somewhat close… Then, it was ‘only’ a matter of determining the different substrates for all these enzymes. To do this, we used a very methodical approach (ahem…): we browsed through the Sigma catalogue and ordered any compound with a structure similar to maltose. We then tested activity of all these enzymes against the different substrates – by performing what seemed to be (and in fact really were) a gazillion enzyme assays.
This resulted in an impressive amount of data: kinetic parameters for all these enzymes – present-day and reconstructed, ancient ones – for the different substrates tested. However, data is only data, no matter how much there is of it. I think we have all sat through enough excruciating powerpoint presentations or struggled to make sense of figures and tables in papers to realize that lots of data is one thing, but the key to getting your point across is often the way this data is visualized. We tried different ways to depict all the hard numbers we had on enzyme activity in a way that did not make people cringe- and did not require a 20 min explanation on what was shown in the different graphs. In the end, it was Chris who found a very elegant way to both show the duplication events leading to the present-day alleles, and the activity of each of the enzymes for the different substrates tested (Figure 2 of the paper, also known to all our lab members as ‘the rainbow’ figure, see below).
As scientists, most of us are focused on carrying out experiments and gathering data – but working on this manuscript really showed all of us just how important it is to spend just as much time on thinking about exactly how to depict all this data.
Copyright: © 2013 Karin Voordeckers. The above content is licensed under the Creative Commons Attribution License (CC-BY), which permits unrestricted use, distribution, and reproduction in any medium, provided the original author and source are credited. 
If you find this essay offensive or in violation of your rights, please email to [email protected]
COMMENTS